Conversion rate benchmarks by industry: e-commerce, SaaS, travel, healthcare and education
What counts as a good conversion rate depends on what you count as a conversion. The 2026 benchmarks for each industry, with their sources, and how to tell whether your own rate is a problem.
- There is no single good conversion rate. Published averages run from about 2% for e-commerce purchases to more than 6% for lead-based industries, because each report counts a different action.
- Match the conversion event before you compare. A purchase, a demo request and a landing page form fill are different commitments, and their benchmarks are not interchangeable.
- Traffic mix moves the number more than industry does. In the same 2026 dataset, paid search converts at 5.4% and paid social at 2.11%, so compare channel by channel.
- Your own baseline is the benchmark that matters. Split your rate by channel and intent, then judge it on revenue per visitor or qualified pipeline, not on the percentage alone.
A good conversion rate depends on the action you count and the traffic you send. In 2026 data, online stores turn roughly 2% of visits into purchases, while lead-based businesses such as software, legal and education turn 6% to 8% of sessions into a qualified lead or a sale. These are different measurements, and comparing one with the other tells you nothing.
Conversion rate benchmarks are one of the most searched, shared, and misunderstood metrics in digital marketing. The appeal is obvious: a single number that tells you whether you are doing well, underperforming, or ahead of the curve. The problem is that benchmarks are often treated as absolutes when they are anything but.
This article gives the current benchmarks by industry, each with its source, its date and the action it counts. It then explains why reports disagree, how traffic source and device change the number, and how to work out whether a rate below the benchmark is a real problem on your website.
What is a good conversion rate?
Three widely used benchmarks give three answers. IRP Commerce reports that 2.23% of visits to the UK and Irish online stores it tracks ended in a purchase in August 2026. Ruler Analytics puts the average rate at which sessions become a qualified lead or a sale at 5.13% across 13 industries in 2026. Unbounce found a median conversion rate of 6.6% across more than 41,000 landing pages in its 2024 report.
None of these numbers contradicts the others. A purchase is a larger commitment than a form fill. A whole website includes visitors who came to read one article, while a campaign landing page receives only people who clicked an ad or an email. An average is pulled up by a few very strong performers, and a median is not.

So the useful question is narrower than “what is a good conversion rate”. It is: what do businesses like mine see, for the same action, from similar traffic? The sections below answer that for each industry, and then show how to answer it with your own data.
All of the figures in this article count primary conversions: purchases, demo requests, bookings, enquiries and qualified leads. Newsletter sign-ups, downloads and other micro-conversions are excluded.
Conversion rate benchmarks by industry (2026 update)
The broadest current dataset is the Ruler Analytics 2026 benchmark, built on more than 110 million sessions and 5 million conversions in 13 industries. It counts a conversion as a qualified lead or a sale, from all traffic sources combined. Use it as a first orientation, then go to the table for your own conversion event.
Industries that sell through a sales conversation, such as legal, software and professional services, sit at the top because the action they count is an enquiry. Industries where the conversion is a payment or a booking sit at the bottom. The order of the chart reflects the size of the commitment more than the quality of the websites.
E-commerce: visits that end in a purchase
For online stores the conversion event is the purchase. IRP Commerce reports an average of 2.23% for August 2026 across its UK and Irish merchants. Shopify’s August 2026 review cites a global figure of 1.4% for the first quarter of 2026 from Statista and 2.66% from Dynamic Yield. By store category, the same review lists the following purchase rates for June 2026:
| Store category | Purchase conversion rate |
|---|---|
| Pet care and vet services | 5.7% |
| Beauty and personal care | 5.32% |
| Food and beverage | 4.58% |
| Fashion, accessories and apparel | 2.77% |
| Consumer goods | 1.76% |
| Home and furniture | 1.29% |
| Luxury and jewelry | 0.63% |
The spread between categories is wider than the spread between sources. A jewelry store converting at 1% is well above its category, and a pet care store at 3% is well below. This is also why conversion rate alone is a poor measure for a store: low-rate categories usually carry high order values. Compare on revenue per visitor, and see where online stores lose sales between product page and checkout.
B2B SaaS: visitors who become leads
For B2B software the first conversion event is a lead: a demo request, a trial start or a contact form. First Page Sage published funnel benchmarks in June 2025 from more than 50 B2B SaaS companies, most with $10 million to $100 million in revenue. Visitor-to-lead rates depend heavily on the channel:
| Traffic source | Visitor to lead | Lead to marketing qualified lead |
|---|---|---|
| 2.2% | 38% | |
| SEO | 2.1% | 41% |
| 1.3% | 43% | |
| Webinar | 0.9% | 44% |
| PPC | 0.7% | 36% |
The same report shows the trade-off between volume and deal size. Companies selling to enterprises convert 0.7% of visitors into leads, and companies selling to small businesses convert 2.3%. A SaaS website at 1% is not underperforming if those leads become qualified pipeline. Trial-to-paid conversion is a separate measurement, covered in the free to paid conversion rate benchmarks for SaaS.
Travel, healthcare, education, agencies and services
For these audiences the conversion event is a booking, an appointment request or an enquiry. No public benchmark isolates those events with a disclosed sample, so the closest reference is the Ruler Analytics figure for each industry, which counts qualified leads and sales together.
| Audience | Conversion event to measure | Closest published benchmark | What the benchmark counts |
|---|---|---|---|
| Travel | Booking | 1.9% | Qualified lead or sale, travel industry |
| Healthcare and clinics | Appointment request | 2.3% | Qualified lead or sale, health and social care |
| Education | Enquiry or enrollment | 6.3% | Qualified lead or sale, education |
| Agencies | New client enquiry | 6.2% | Qualified lead or sale, marketing and advertising |
| Professional services | Consultation or quote request | 6.1% | Qualified lead or sale, professional services |
Read these as ranges of what is common, not as targets. Travel sits lowest because a booking is a payment made after several visits, often on a different device. Education and agencies sit higher because the counted action is a first enquiry, which costs the visitor nothing.
Why the same industry shows different numbers
A conversion rate benchmark is a reference value calculated from the performance of many different websites within the same industry. It reflects how often a defined action occurs across that sample. What benchmarks include is scale. What they exclude is context.
Four choices made by the publisher of a report decide the number you read:
- The action counted. What counts as a conversion can range from a newsletter sign-up to a high-intent demo request. Even within the same industry, these actions carry very different success rates.
- Average or median. A few exceptional websites raise an average. The median describes the typical website and is usually lower.
- Whole website or landing page. Landing page reports measure visitors who already clicked an ad. Website reports include every visitor, whatever brought them.
- The sample. Each report covers the customers of one platform, in certain countries, of a certain size.
Benchmarks also do not account for traffic quality. A site driven primarily by high-intent branded traffic will naturally convert at a higher rate than one relying on broad, informational queries or cold paid acquisition. Benchmarks typically blend these together.
- Purchases
- Demo and quote requests
- Bookings and enquiries
- Branded and non-branded search
- Paid, organic and social traffic
- Mobile and desktop
- A landing page median against a whole-website average
- A purchase rate against a lead rate
They are reference points, never verdicts.
Benchmarks are useful for orientation. They give a rough sense of what is common across a market. They do not describe what is optimal, achievable, or appropriate for a specific business. They are reference points, never verdicts. Interpreting them correctly requires knowing what they measure, and what they leave out.
How traffic source and device change the benchmark
Where visitors come from has a bigger effect on conversion than the industry you are in. In the Ruler Analytics data, the gap between the best and worst industry is about four times. The gap between paid search and paid social, inside the same industries, is about two and a half times, and most websites can change their channel mix far faster than their industry.
Device has a similar effect. Contentsquare retail data, cited by Shopify, puts the purchase rate at 3.7% on desktop and 2% on mobile. Unbounce found that 83% of landing page visits came from mobile devices and that desktop converted 8% better. A store with mostly mobile, social traffic and a store with mostly desktop, search traffic should not expect the same rate, even when they sell the same product.
Common mistake: comparing a blended website rate with an industry average and concluding that the website underperforms. If half of your sessions come from social campaigns or informational articles, a rate below the average is the expected result of the mix. Compare each channel with its own benchmark before you change a page. The method is in how to tell whether a low conversion rate comes from the traffic or the website.
Why benchmarks mislead when they become targets
The problem with conversion rate benchmarks is not how they are calculated, but how they are used. In practice, benchmarks tend to become targets, even when no one explicitly says so. Teams start optimizing to reach the industry average instead of improving the underlying economics of the business.
- Optimizing for the metric, not the outcome. Teams push for higher conversion rates by lowering friction indiscriminately, simplifying forms, or broadening calls to action. Conversion rate goes up, but lead quality drops. Sales teams feel the impact long before dashboards reflect it.
- False underperformance. A company may sit below an industry benchmark while still outperforming peers in revenue, pipeline value, or customer lifetime value. This is common in enterprise SaaS and high-ticket B2B, where fewer, better conversions matter more than volume.
- Distorted priorities. When teams focus on closing a perceived gap to an average, they often ignore higher-impact opportunities such as segment-level optimization, intent differentiation, or improving later funnel stages.
- Timing. Benchmarks are backward-looking by nature. They reflect what was common across many companies at a given moment, not what is effective for your audience right now.
The same logic applies to lead generation. A B2B website that halves its form fields may double its conversion rate and send sales twice as many leads that never qualify. For a store, the measure that settles the question is revenue per visitor. For a B2B website, it is qualified pipeline per visitor.
How to set your own conversion rate benchmark
The benchmark that tells you something is your own rate, for one conversion event, split by the segments that behave differently. It takes five steps and the analytics you already have.
- Choose one primary conversion event and keep it fixed: purchase, demo request, booking, appointment request or enquiry.
- Pull sessions and conversions for the last 90 days, so that weekly swings and single campaigns do not distort the figure.
- Split the rate by traffic source and by device. Add a split between new and returning visitors if your buying cycle takes more than one visit.
- Compare each segment with the benchmark for the same event and the same channel, using the tables above.
- Add the value measure next to each rate: revenue per visitor for a store, qualified leads or pipeline for a B2B website.
| Segment | Sessions | Conversions | Rate |
|---|---|---|---|
| Paid search | 12,000 | 300 | 2.5% |
| Direct and branded search | 8,000 | 200 | 2.5% |
| Organic search, informational articles | 20,000 | 100 | 0.5% |
| Whole website | 40,000 | 600 | 1.5% |
In this example the website as a whole converts at 1.5%, which would read as weak against almost any benchmark. The split shows that visitors who arrive with buying intent convert at 2.5%, and that informational articles bring half of the sessions and one sixth of the conversions. The website does not have a conversion problem. It has a large audience that is not ready to buy, which calls for a softer next step on those pages, not a redesign.
Segment rates need volume. With fewer than about 100 conversions in a segment over the period, a change of a few conversions moves the rate by a large amount and the comparison is noise. On a low-traffic website, track the blended rate over a longer period and treat benchmarks as rough orientation only.
Once the baseline exists, improvement is measured against it, not against the industry. Users convert through sequences of interactions, not isolated pages, so the gains usually come from high-intent segments and from the steps between pages. The wider method is in the guide to conversion rate optimization.
A rate that looks average and still changed the business
A small change in conversion rate can look insignificant against industry benchmarks, but in high-intent, high-ticket environments, those gains often translate into meaningful business outcomes.
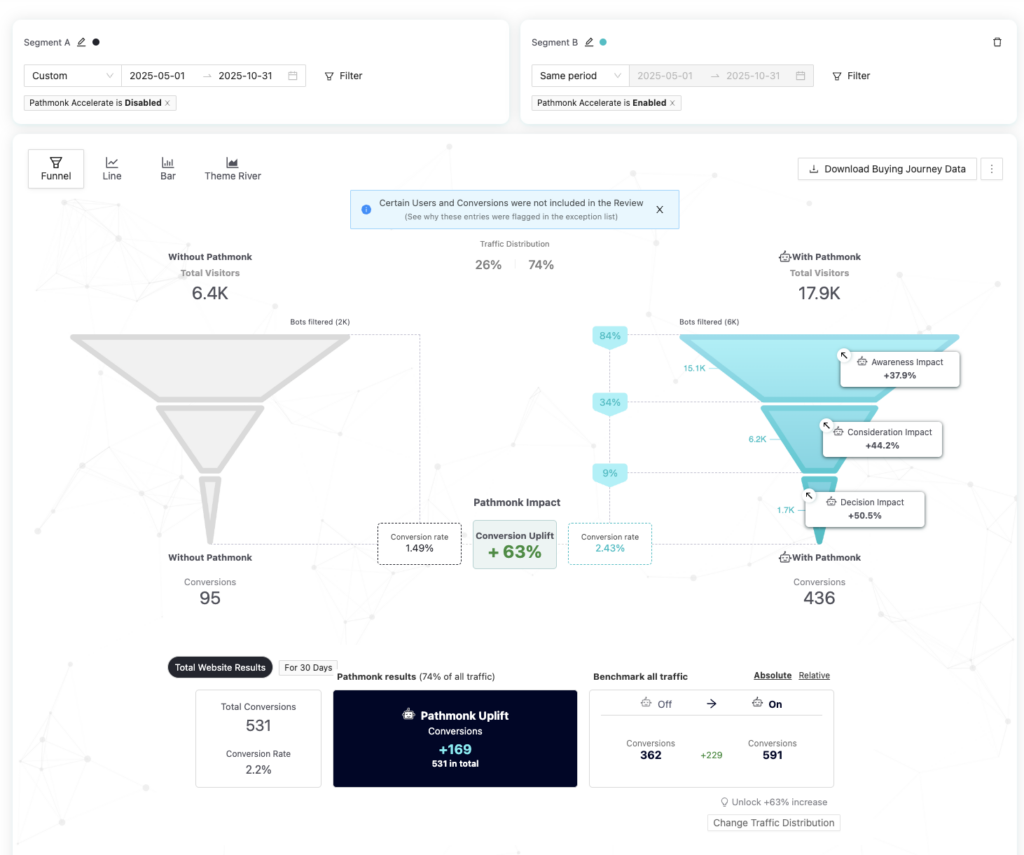
Forrest Technical Coatings, a B2B manufacturer of industrial coatings, had steady traffic but very few sales requests. The website was outdated and difficult to change, and the marketing team had no realistic way to run traditional CRO experiments or redesign the site.
Instead of rebuilding the website, the focus shifted to how high-intent visitors moved through the buying journey. Pathmonk was used to identify visitor intent in real time and guide each visitor toward the most relevant next step, without modifying the website itself. It ran on a 50/50 split, so the result could be measured against an untouched control group.
Over six months, conversion rate rose 63%, from 1.49% to 2.43%, and 169 additional sales requests were directly attributable to Pathmonk. From a benchmark perspective, the final conversion rate still looked average for a B2B manufacturing site. From a business perspective, it represented a significant increase in qualified, high-value sales opportunities.
Key takeaways
- There is no single good conversion rate. Published averages differ because each report counts a different action on a different kind of page.
- Match the conversion event first: purchase, demo request, booking, appointment or enquiry. Benchmarks for different events are not interchangeable.
- In 2026 data, the average e-commerce purchase rate is between 1.4% and 2.7%, and the average qualified lead or sale rate across 13 industries is 5.13%.
- Traffic source changes the rate more than industry does: paid search converts at 5.4% and paid social at 2.11% in the same dataset.
- Benchmarks are orientation, not targets. Chasing an average by removing friction for everyone raises the rate and lowers lead quality.
- Judge an online store on revenue per visitor and a B2B website on qualified pipeline. The percentage alone hides the value of each conversion.
- Your own baseline, split by channel and intent, is the benchmark that matters. Improve it segment by segment.
- A rate that looks average by benchmark can still represent a large gain: Forrest Technical Coatings moved from 1.49% to 2.43% and added 169 sales requests.
FAQs about conversion rates by industry
What is a good conversion rate?
There is no single figure. In 2026 data, the average e-commerce purchase rate sits between 1.4% and 2.7% depending on the source, and the average qualified lead or sale rate across 13 industries is 5.13%. A good rate is one that is above your own baseline for the same conversion event and the same traffic mix, and that holds up on revenue per visitor or qualified pipeline.
What is a good e-commerce conversion rate?
Published 2026 averages for the purchase rate range from 1.4% (Statista, global) to 2.23% (IRP Commerce, UK and Ireland) and 2.66% (Dynamic Yield, global). Category matters more than the average: beauty and pet care stores report rates above 5%, while home, furniture, luxury and jewelry stores report rates near or below 1.3%. Judge an online store on revenue per visitor, not on conversion rate alone.
Are conversion rate benchmarks different for mobile vs desktop?
Yes. Desktop traffic typically converts at a higher rate than mobile, especially for complex or high-commitment actions such as demo requests or sales inquiries, though it depends heavily on the type of business. Mobile traffic often plays a stronger role earlier in the journey, while desktop is more common closer to conversion. Comparing device-agnostic averages can hide this difference.
Should I benchmark against competitors or industry averages?
Industry averages are usually more reliable than competitor benchmarks. Competitor data is rarely comparable because traffic mix, conversion definitions, and business models differ significantly. Benchmarks are best used as high-level reference points, not as direct performance targets.
Is a higher conversion rate always better?
Not necessarily. A higher conversion rate can be misleading if it comes from lowering friction indiscriminately or attracting low-quality leads. In many cases, a lower conversion rate paired with higher intent and better lead quality produces stronger business outcomes.
How often should conversion benchmarks be revisited?
Benchmarks should be revisited periodically, but not used for ongoing performance evaluation. They are most useful when entering a new market, launching a new funnel, or reassessing expectations. Day-to-day optimization should focus on internal baselines and trend improvements instead.
Why can two companies in the same industry perform well with very different conversion rates?
Because conversion rates are shaped by intent, funnel complexity, deal size, and sales motion. Two companies can convert at different rates and still generate similar revenue if the quality and value of their conversions differ. Industry labels alone do not capture this nuance.
- Ruler Analytics: conversion rate by industry, 2026 (ruleranalytics.com, published May 2026)
- IRP Commerce: e-commerce market data, August 2026 (irpcommerce.com)
- Shopify: e-commerce conversion rate, citing Statista, Dynamic Yield and Contentsquare (shopify.com, August 2026)
- First Page Sage: B2B SaaS funnel conversion benchmarks (firstpagesage.com, June 2025)
- Unbounce: conversion benchmark report (unbounce.com, 2024)